Introduction
This post is going to be a departure from the usual genomics tilt of this blog. I’ve recently been interested in the science (art?) of hedging a stock portfolio against market downturns. Hedging is difficult and involves the selection of the right asset class, right allocation (holding too much of the hedge and you under perform in all markets) and right time to remove the hedge (ideally at the bottom of a correction). If the VIX (CBOE Volatility Index) were directly investable, holding it as an asset in a portfolio would provide a significant edge. However, you cannot directly “buy” the VIX, and tradable VIX products (like VXX, UVXY, etc) have notable under performance when used as a hedge (Bašta and Molnár, 2019).
A paper by James Doran (2020) proposed that a portfolio of SPX options that is highly correlated to the VIX could be held as a long-term hedge. The portfolio buys an ITM-OTM put spread and sells an ATM-OTM call spread when the VIX is at normal values, and does not hedge when the VIX is above the mean plus one standard deviation. In this way the portfolio systematically removes the hedge when vol is the most expensive and therefore more likely to revert to the mean. For example, if SPX was at 3800 and VIX was at normal levels, the portfolio would allocate 1% to the following option spreads with one month expiration. The payoff with SPX at various levels at expiration is shown below. Importantly, this spread has positive theta, and only begins to lose if SPX closes above 3850.
| ITM/OTM % | Put/Call | Strike | |
|---|---|---|---|
| Buy | 5% ITM | Put | 3990 |
| Sell | 5% OTM | Put | 3610 |
| Sell | ATM | Call | 3800 |
| Buy | 5% OTM | Call | 3990 |
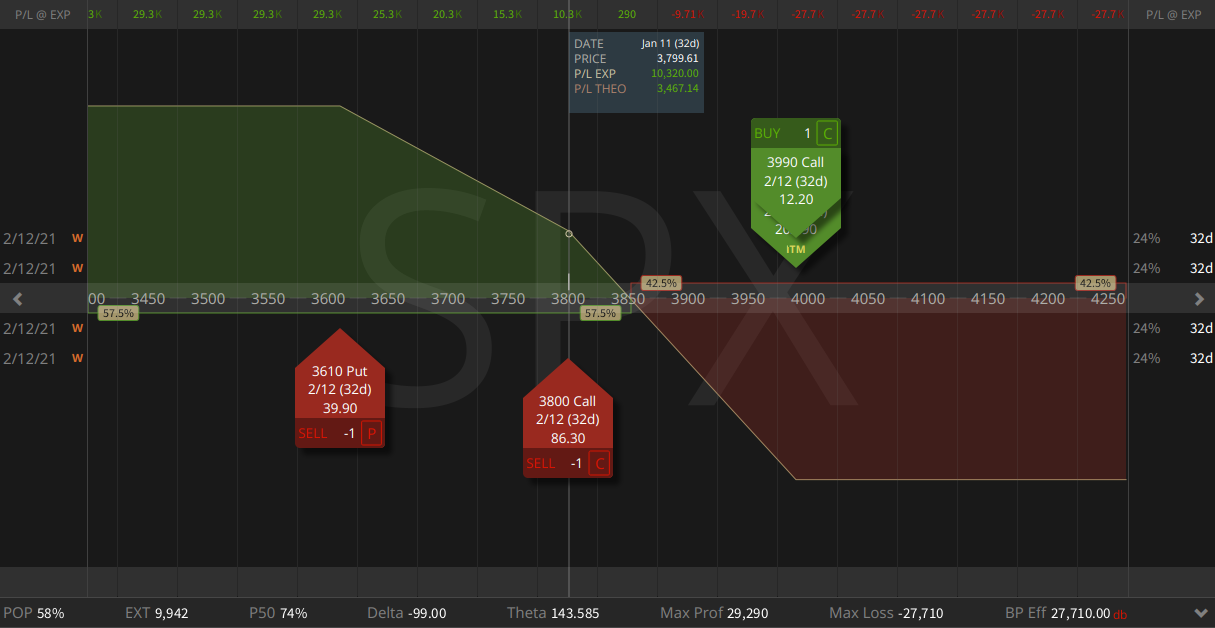
P/L of the option spread at expiration. Cost = 8710, max gain = 29290, max loss = 27710.
I was interested in replicating the results of this paper, extending the findings to the end of 2020 (the paper stops in 2017), and finding if the option portfolio would hedge a leveraged stock portfolio holding UPRO (3X leveraged S&P500).
Step 0: Obtain data, write backtest code
Option data: I obtained end of day option prices for the SPX index from Stanford’s subscription to OptionMetrics for 1996-2019. 2020 data were purchased from historicaloptiondata.com.
Extended UPRO and TMF data: These products began trading in 2009, but we definitely want to include the early 2000s dotcom crash and 2008 financial crisis in our backtests. Someone on the bogleheads forum simulated the funds going back to 1986, and they’re available here
Backtesting: I wrote a simple program to backtest an option portfolio in R. This program buys a 30 DTE spread as described above and typically holds to expiration. When VIX is low, a fixed percentage of the portfolio value is placed into the option portion during each rebalance, which occurs when the options expire. When VIX is high (above mean plus one standard deviation), the portfolio only holds the base asset class. If VIX transitions from low to high, the hedge is immediately abandoned, and if VIX transitions from high to low, the hedge is repurchased.
Step 1: replicate the results of Doran (2020) with the SPX index
To ensure our option backtest works as expected, I first replicated the results from the Doran paper using the SPX index. I allocated a fixed 5% to the hedge. I found performance was improved by using options 10% ITM or OTM, so these were used in all backtests. Below are the returns of these portfolios from 1996-2020, starting with $100,000. Although the hedge does well in negative markets, the under performance in the bull market of the last 10 years is quite apparent. The hedge also didn’t protect much against the rapid COVID crash in March 2020 – I think because VIX spiked very quickly and the portfolio wasn’t hedged for much of the crash. My results don’t exactly match those in the paper (even using a 5% spread width). I think differences in the option prices, especially early in the dataset, are playing a role in this.
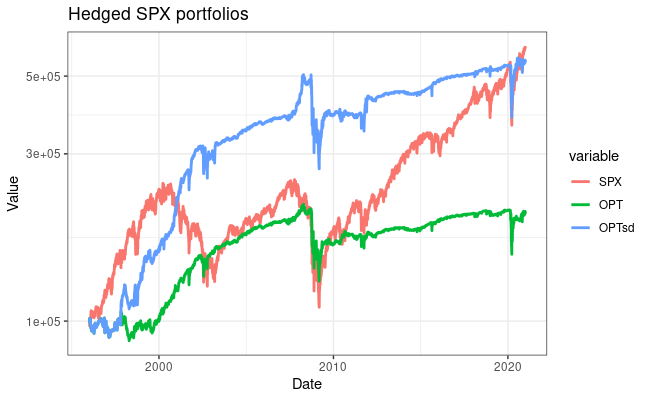
Equity curves for option hedged SPX portfolios. SPX = un-hedged. OPT: always hedged 5%. OPTsd: hedged 5% when VIX is below the mean plus one standard deviation.
| SPX | OPT | OPTsd | |
|---|---|---|---|
| CAGR | 7.49 | 2.91 | 7.08 |
| Sharpe ratio (Annualized) | 0.48 | 0.39 | 0.64 |
| StdDev (Annualized) | 15.3 | 7.71 | 11.23 |
| Worst drawdown | 52.5 | 35.2 | 41.2 |
Step 2: extend the option hedge to a portfolio holding UPRO
How does the hedge work using 3X leveraged fund UPRO? I conducted the same backtest, and found that 10% allocated to the hedge is better. This makes sense – you need something with higher volatility to balance out the extreme swings in UPRO. Hedged performance is definitely better than holding UPRO alone, which has pathetic stats over this time period. Better returns than holding SPX alone, but more variance and a equivalent Sharpe ratio. Holding the VIX as an asset is still the winner here.
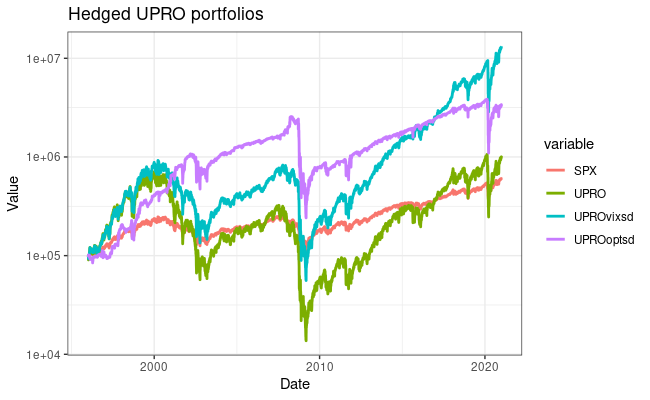
Equity curves for option hedged UPRO portfolios. SPX: un-hedged, UPRO: un-hedged, UPROvixsd: holding VIX as hedge when VIX is low, UPROoptsd: holding option hedge when VIX is low.
| SPX | UPRO | UPROoptsd | UPROvixsd | |
|---|---|---|---|---|
| CAGR | 7.49 | 9.71 | 15.1 | 21.6 |
| Sharpe ratio (Annualized) | 0.48 | 0.20 | 0.49 | 0.53 |
| StdDev (Annualized) | 15.3 | 46.8 | 31.6 | 40.5 |
| Worst drawdown | 52.5 | 97.4 | 87.7 | 91.7 |
Comparison to a UPRO/TMF portfolio
The option-hedged portfolio needs to outperform a 55/45% UPRO/TMF portfolio for me to consider running it for real. I used portfoliovisualizer.com to easily compare these portfolios with monthly rebalancing.

Portfolio 1 (blue) : UPROoptsd Portfolio 2 (red) : UPRO/TMF 55/45 Portfolio 3 (yellow): UPRO/VIX 70/30
The returns with TMF have less variance than the option hedged portfolio and end up almost exactly equal at the end of this time period. However, in 1996-2008, the option portfolio definitely outperformed. Holding VIX is again the clear winner in both absolute and risk-adjusted returns, but still suffers severe drawdowns.
Conclusions
I don’t think holding this portfolio will provide a significant advantage compared to a UPRO/TMF portfolio. Given the limitations below and no significant advantage in the backtest, I won’t be voting with my wallet. The option hedge portfolio did provide significant advantages in the 1996-2008 period, where it outperformed all other portfolios (even the optimal 70/30 UPRO/VIX!) with a Sharpe ratio of 1.01 and max drawdown of 47% in the dotcom crash. I may paper-trade this strategy to get a feel for position sizing, slippage and fills on these spreads, though.
Limitations: Why I won’t be hedging with this method
- This model assumes all transactions occur at the midpoint of the bid-ask spread and does not take into account transaction costs. While transaction costs are relatively small, SPX and XSP can have relatively wide bid-ask spreads, much wider than SPY.
- Options can by illiquid, only purchased in fixed quantities, and difficult to adjust. Today with SPX at 3750, Buying one SPX 30d 5% ITM-OTM put spread costs $16100. Adding the call spread brings the cost down to $9340 but brings the max loss of the position to $27340! Trading on XSP brings the cost down by a factor of 10. With a 1% hedge, this method is only good for portfolios >100k. As a 5% hedge this can be used on a portfolio as small as 20k. Still, what do you do when the optimal amount of hedge is 1.5 XSP contracts?
- It’s more complicated than simply rebalancing between UPRO and TMF, requiring more active management time.
- The option hedge didn’t even outperform UPRO/TMF in some regards!
- Backtests are only backward-looking and easy to overfit to your problem.
Future directions to explore
- Optimal hedge amount – was not optimized scientifically, I just tried a few values and decided based on returns and Sharpe ratio.
- Differing DTE on position opening an closing. 30 days and holding to expiration may not be optimal.
- Selecting strikes based on Delta instead of fixed percentage ITM/OTM. This would result in different strikes selected in times of low and high vol, but probably has a minimal impact.
- The max loss of these spreads can be quite high compared to the cost to enter the trade – maybe the hedge amount should be scaled based on the max loss of the position (with the remaining invested in the base asset or held in cash).
Questions? Other ideas to test? Let me know! I’ll also happily release returns or code (it’s not pretty) if you are interested.
References:
1.Doran, J. S. Volatility as an asset class: Holding VIX in a portfolio. Journal of Futures Markets 40, 841–859 (2020).
2.Ayres, I. & Nalebuff, B. J. Life-Cycle Investing and Leverage: Buying Stock on Margin Can Reduce Retirement Risk. https://papers.ssrn.com/abstract=1149340 (2008).
3.Ayres, I. & Nalebuff, B. J. Diversification Across Time. https://papers.ssrn.com/abstract=1687272 (2010).
4. Bašta, M. & Molnár, P. Long-term dynamics of the VIX index and its tradable counterpart VXX. Journal of Futures Markets 39, 322–341 (2019).
Leveraged portfolio background
The leveraged portfolio idea comes from the famous “HEDGEFUNDIE’s excellent adventure” thread on the Bogleheads forum (thread 1, thread 2) with ideas going back to “lifecycle investing” and “diversification across time” from Ayres and Nalebuff (2008, 2010). Basically, it makes sense to use leverage to obtain higher investment returns when you’re young and expect to have higher earnings in the future. You can do this with margin, futures, LEAPS options, or leveraged index funds. The leveraged funds appear to be the easiest way to obtain consistent and cheap leverage without risk of a margin call. The portfolio holds 55% UPRO and 45% TMF (3X bonds) and typically rebalances monthly. I’ve also thrown some TQQQ (3X leveraged NASDAQ) into the mix. These portfolios outperform a 100% stocks or an unleveraged 60/40 portfolio on BOTH a absolute and risk-adjusted return basis. However, if you could hold VIX as an asset to rebalance out of, performance would be even better. Hence my interest in replicating the a VIX hedge with options.