Edit: full writeup on this topic posted here.
In my last post about hedging a portfolio with options, I looked at how a complicated 4-option spread could replicate the VIX index and hedge against market volatility. Now, we’re going to look at a simpler, explicit “tail risk” hedge using VIX calls. This strategy is based on the VXTH index (VIX Tail Hedge), which buys 30 delta VIX calls with 1% of the portfolio when volatility is low, and allocates the rest into the SPX index. Looking at the performance of the index below, three things are immediately clear:
- VXTH did well, but not stellar, in 2008-2009
- VXTH slightly underperformed the benchmark during the bull market of 2010-2020
- VXTH absolutely skyrocketed during the COVID crash of 2020. I think this played right into the strengths of the hedging program: a rapid VIX spike, followed by quick recovery of SPX.
We’re going to look at replicating the VXTH index and extending the methodology to other portfolios, including a leveraged ETF portfolio holding UPRO and TMF.
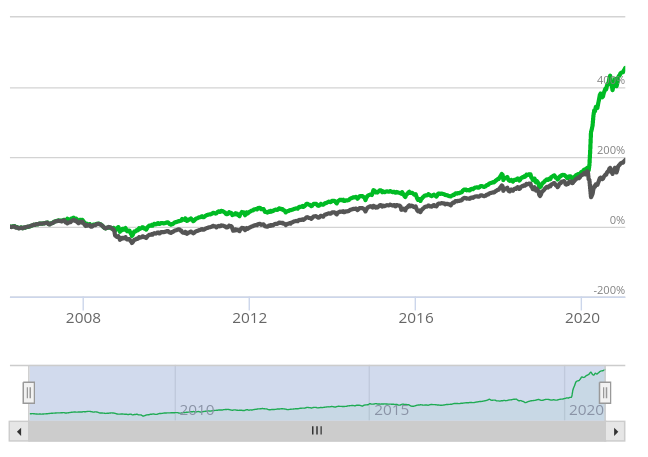
Equity curves of VXTH (green) compared to SPX (black) from 2006-2020.
How does VXTH work?
The methodology is simple. Each month, the look at the front month VIX futures contract and decide how to allocate to the hedge. With the specified fraction of the portfolio, buy 30 delta VIX calls with one month to expiration.
| VIX future value | Portfolio allocation |
|---|---|
| X <= 15 | 0% |
| 15 > X <= 30 | 1% |
| 30 > X <= 50 | 0.5% |
| X > 50 | 0% |
N.B. The phrase “forward value of VIX” on the CBOE website is strange and doesn’t have an explicit meaning (at least to me). I confirmed the index is looking at the front month VIX future rather than spot VIX by examining the trade log on the CBOE website.
Why hedge with VIX calls?
I think the main reason for using VIX calls as a tail risk hedge is the convexity embedded in the option. In times of low vol, the calls are cheap, and a 1% allocation can buy your portfolio many many OTM calls. But when tail risks come to fruition and VIX spikes like it did in March 2020, the value of the options goes parabolic. If you have the hedge on before everyone else in the market is trying to hedge, you’re in a great position. VIX options are also very liquid in a crisis, in times when other instruments can be illiquid and difficult to unwind for big positions.
Replicating the VXTH index
Similar to the last post, I obtained VIX option data from IvyDB and historicaloptiondata.com. /VX prices were obtained from the Quandl continuous futures dataset. Backtesting was done with a custom R program. Option transactions occur at the midpoint of the bid/ask spread and have no transaction costs (big caveat here!). I first replicated VXTH, and equity curves are below. However, I’m still experiencing some tracking error compared to the benchmark, especially in 2020. I think this could be due to differences in my price data or timing luck (see the future directions section). Still, the VXTH replication captures most of the movement of the benchmark and has no drawdown in March 2020.

Equity curves for my replicated VXTH (red) compared to the benchmarks.
Extension to a UPRO/TMF portfolio
How does adding a VIX call hedge deal with the added volatility of a leveraged portfolio? Quite well! Using the same parameters and a portfolio of 55% UPRO, 45% TMF, the equity curves are below. The outperformance in 2020 isn’t very visible on the log scale, but the VIX call hedged portfolio ends the backtest with a 30% higher balance. The stats on the hedged portfolio are also excellent – improved total and risk-adjusted return, and a comparable drawdown to holding SPX alone. So far, this looks really good!
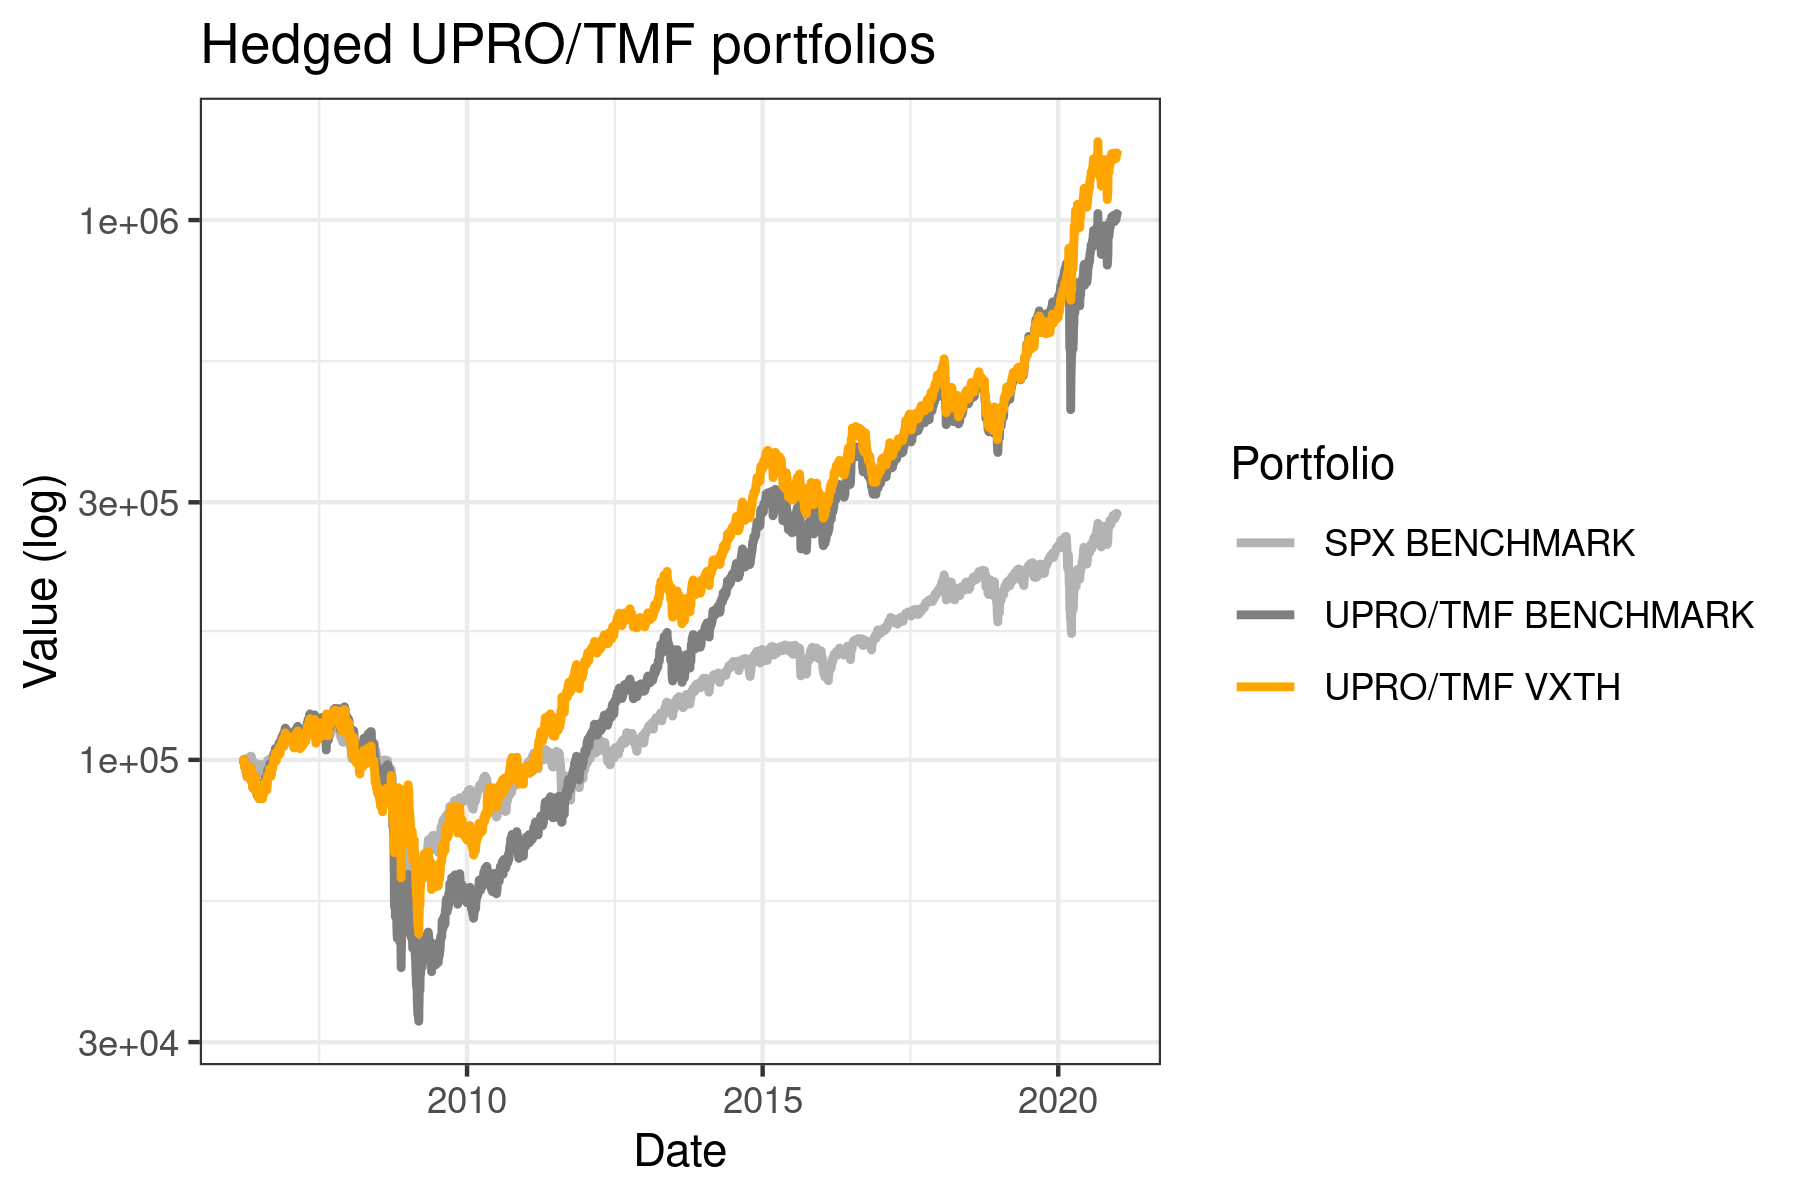
Equity curves of hedged UPRO/TMF portfolio compared to benchmarks
| SPX | VXTH (benchmark) | VXTH (replicated) | UPRO/TMF | UPRO/TMF + VXTH | |
|---|---|---|---|---|---|
| CAGR | 7.49 | 12.2 | 8.8 | 17.1 | 19.2 |
| Sharpe ratio (Annualized) | 0.49 | 0.67 | 0.66 | 0.70 | 0.87 |
| StdDev (Annualized) | 15.2 | 18.3 | 13.5 | 25.0 | 22.4 |
| Worst drawdown | 52.5% | 37.4% | 35.1% | 70.9% | 57.2% |
Conclusions
Adding a small, constant allocation to VIX calls can improve the absolute and risk-adjusted returns of a portfolio of stocks or leveraged stocks/bonds, at least in the period I backtested. This method is relatively simple compared to the 4 option method I tested in the last post, and only requires management once per month, which can coincide with a monthly portfolio rebalance. There are a few optimizations I want to test before running this method live. I also need to include transaction costs and slippage into my model.
Future directions
I noticed some timing luck in replicating VXTH, specifically around the COVID crash. Slightly changing the days to expiration of the calls would result in very different outcomes, because the VIX calls could be held through the entire crash instead of sold at the “right” time. I think that’s part of why VXTH did so well in March – the VIX peak was right at an option expiration, so the position was exited at just the right time. Ideally we’d strive eliminate this timing luck from a portfolio. I can see a few ways to do this, that I’ll think about implementing in my backtests:
- Instead of holding to expiration, positions should be dynamically opened or closed when VIX crosses one of the allocation thresholds.
- Holding a “ladder” of calls with different expirations to reduce the effect of timing.
- Daily rebalancing (probably not a good idea in practice because of transaction costs).
I want to optimize some other parameters, while being wary of the possibility of overfitting to the relatively few “tail risk” events that have happened in my dataset.
- Allocation amounts (probably more hedge is better with the leveraged portfolio)
- Hedge thresholds. Analyzing the transition matrix from one VIX state to the next may help with this.
- Option delta. Lower delta options will give you more convexity when the rare crashes happen, but you may not benefit from small VIX spikes.
Great post! I found this while trying to find a way to invest in VXTH. I believe there used to be a fund that tracked it, but unfortunately has shut down. I am running the HF portfolio and was looking at including VXTH as well. Would be interested in seeing any more posts on this!
This is an excellent post! How did you get the VXTH data?
The VXTH data can be scraped from CBOE: https://www.cboe.com/us/indices/dashboard/VXTH/
Such an informative post. Been giving this strategy a lot of thought and I’m happy others have the fortitude to investigate.
Some follow up questions. What would the result be of a 97% UPRO, 3% VIX tailing hedge account? (and subsequently scaling down to 1.5% when VIX is between 30 and 50). This is more capital efficient than spending 55% on TMF, which I know has become a very popular strategy. I would imagine that 97% UPRO would outpace many alternatives in a bull market. You could even increase VIX tailing allocation to 6% and still be up in a bull market AND a black swan event. Very curious to see this simulated.
What are the effects of buying 60 DTE calls and rolling out every 30 days? This would minimize theta decay, which ramps up within the final 30 of expiry.
In order to minimize premium paid for the VIX call, you could sell the same number of OTM puts expiring the same day. How would that look?
Also, be careful fo your optimization points at the end of your article. This is where you’ll hear a lot of people echo “past results aren’t indicative of future earnings” and is what you hear a lot in the algotrading forums. All to say that optimizing the hedge threshold may not be as informative as you may think.
I agree, with only a few high-volatility events in the last 20 years, it’s quite hard not to overfit to those few.
Interesting article which I also found when looking for investing in the VXTH index (which is not possible I understand).
It seems like the tail rish hedge did not really materialize during the financial crisis in 2008 as the graph also shows a sharp decrease in performance although vix spiked back then. How is that possible ?
Thanks
Why would hedging allocation be 0% when VIX is sub 15? This would seem to be the best opportunity to be long VIX calls with cheap premium.
VIX never goes straight from super low to super high, so you avoid wasting money hedging when a crash has no chance of happening. Of course, this parameter could be optimized.
Thank you very much for your contribution. I am currently in the process of scientifically examining my risk mitigation strategy (VIX) and implementing it in R. Is the proposed portfolio allocation also published in one of your academic articles that I could cite for reference?
You are welcome to cite this blog, and can see the final version at this PDF: https://www.bsiranosian.com/wp-content/uploads/2025/05/mse448_final.pdf