After sequencing a community of bacteria, phages, fungi and other organisms in a microbiome experiment, the first question we tend to ask is “What’s in my sample?” This task, known as metagenomic classification, aims to assign a classification to each sequencing read from your experiment. My favorite program to answer this question is Kraken2, although it’s not the only tool for the job. Others like Centrifuge and even Blast have their merits. In our lab, we’ve found Kraken2 to be very sensitive with our custom database, and very fast to run across millions or sequencing reads. Kraken2 is best paired with Bracken for estimation of relative abundance of organisms in your sample.
I’ve built a custom Kraken2 database that’s much more expansive than the default recommended by the authors. First, it uses Genbank instead of RefSeq. It also uses genomes assembled to “chromosome” or “scaffold” quality, in addition to the default “complete genome.” The default database misses some key organisms that often show up in our experiments, like Bacteroides intestinalis. This is not noted in the documentation anywhere, and is unacceptable in my mind. But it’s a key reminder that a classification program is only as good as the database it uses. The cost for the expanded custom database is greatly increased memory usage and increased classification time. Instructions for building a database this way are over at my Kraken2 GitHub.
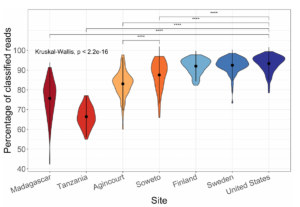
With the custom database, we often see classification percentages as high as 95% for western human stool metagenomic datasets. The percentages are lower in non-western guts, and lower still for mice

Read classification percentages with Kraken2 and a custom Genbank database. We’re best at samples from Western individuals, but much worse at samples from African individuals (Soweto, Agincourt and Tanzania). This is due to biases in our reference databases.
With the high sensitivity of Kraken/Bracken comes a tradeoff in specificity. For example, we’re often shown that a sample contains small proportions of many closely related species. Are all of these actually present in the sample? Likely not. These species probably have closely related genomes, and reads mapping to homologous regions can’t be distinguished between them. When Bracken redistributes reads back down the taxonomy tree, they aggregate at all the similar species. This means it’s sometimes better to work at the genus level, even though most of our reads can be classified down to a species. This problem could be alleviated by manual database curation, but who has time for that?
Also at the Kraken2 GitHub is a pipeline written in Snakemake and that takes advantage of Singularity containerization. This allows you to run metagenomic classification on many samples, process the results and generate informative figures all with a single command! The output is taxonomic classification matrices at each level (species, genus, etc), taxonomic barplots, dimensionality reduction plots, and more. You can also specify groups of samples to test for statistical differences in the populations of microbes.

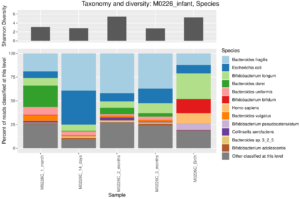
Taxonomic barplot at the species level of an infant microbiome during the first three months of life, data from Yassour et al. (2018). You can see the characteristic Biffidobacterium in the early samples, as well as some human reads that escaped removal in preprocessing of these data.

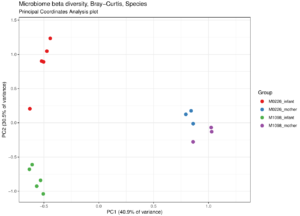
Principal coordinates analysis plot of microbiome samples from mothers and infants from two families. Adults appear similar to each other, while the infants from two families remain distinct.
I’m actively maintaining the Kraken2 repository and will add new features upon request. Up next: compositional data analysis of the classification results.
References:
Wood, D. E. & Salzberg, S. L. Kraken: ultrafast metagenomic sequence classification using exact alignments. Genome Biol. 15, R46 (2014).
Yassour, M. et al. Strain-Level Analysis of Mother-to-Child Bacterial Transmission during the First Few Months of Life. Cell Host & Microbe 24, 146-154.e4 (2018).
